Some weeks ago Tim told me about his idea to create a cache based on tones (frequencies). His idea was, to let the cacher make some tones in a specific order to receive the code for the lock.
A colleague of mine told me that frequency measurement is much more difficult as I would think. Ok, but why not trying? I’m pretty good in programming, but I have no knowledge about electronics. Maybe that was an advantage to start...
To make the story not too long, here’re the main first steps up to a first working prototype:
- First I prepared a sketch just using a microphone and the built in comands inside the IDE. It didn’t worked. I received totally crazy results on measured frequencies.
- Next step was to use the library „FreqCalc“. I made some progress on the measurement, but it was still far away from my target.
- To measure frequencies I was pretty aware, I built with another Arduino a „frequency generator“. Four buttons I added to
- keep the tone
- decrease the frequency by 50%
- increase it by 100%
- and to have no tone
- Now the time started when uggly noise came from my office. So next I put GND of both Arduinos together and put the output of the „generator“ (via a capacitor) to the input of the measuring Arduino.
- After using „FreqMeasure“ as a different library and rewriting the sketch more than 60%, the result is quite fine. Here’s a video of the very first prototype:
As ever: Clicking on „YouTube“ and you’ll be able to watch in 1080p!
What you’ll see on the LCD is the frequency measured, but for testing there’re 2 more information: „cnt“ shows the amounts of measurements taken to calculate the frequency as an average of this probes. „t“ is for the time in milliseconds it took to measure all this probes. My objective is, to have this time less than 1 second.
Update 10/11/2016
I worked on the final sketch already. At this stage I’m planning to run the sketch in 5 steps:
- The cacher has to perform a medium frequency, which will be taken as basis.
- After that a higher one compared to the basis
- Next a lower one compared to the basis
- Next again a higher one as the basis. At this moment I haven’t decided, if it must also higher than the one in step 2
- Last again a lower one, maybe also lower than the one in step 3
Unfortunately I’m on a business trip next days, so the next update will come not earlier than next weekend…
Update 10/16/2016
Meanwhile I’m back from a business trip to Toulouse. Yesterday more or less the whole day was dedicated to work for the nursery. But this afternoon (Sunday) I was able to spend some hours on this cache.
I was quite frustrated, because also the „FreqMeasure“ library isn’t working as I expected. After hours of faults I started to ask Dr. Google and I’ve read a lot. Finally I found a quite easy sketch providing quite good results. I integrated it into my main sketch and it still seemed to work fine.
But I discovered I need to work on the basic of the sketch. I need to find a good solution for when the Arduino is „listing“ for a tone and when not. This sounds so easy, but it isn’t.
I’ll continue when I’ll have time. But now I’m quite confident, I’ll bring the prototype to an end. Just one hour ago I was near to give up...
Update 10/21/2016
I’m very close again to give up. I need to count to realize, which version of the frequency measurement part I’m working now: 1st was an easy version completely designed by me, 2nd was using the library FreqCount, 3rd library FreqMeasure, 4th using an interrupt. Ok, so now I’m working on the 5th one. The 4th version using an interrupt was working pretty fine in „stand-alone mode“. But it’s designed to continuously measure the frequency and showing it. It’s not usable to measure at a given time the frequency and after that doing someting else. When I tried to integrate that version into my main sketch, I stepped from one trouble to the next…
Now I’m working on a 5th version, which was „inspired“ by a sketch, „Dr. Google“ found for me.
But there’s another topic, I worked on and that’s already running pretty fine. The 4th version offered sometimes more than 1 value and it was hard to decide, which ones are ok and which not. For us looking to values like 1000, 1010, 200, 990 it’s clear that the 3rd value (200) is not matching with the other (roughly 1000). I wanted to let the Arduino do that. And it was really like this: A lot of measurements were nearly the same, but one totally different.
A first option would be to work with a pure average. But nearly 800 isn’t good, when reality is 1.000. Second option would be to „investigate“ the 200 and calculating the average out of the 3 „valid“ values 1000, 1010 and 990. But I wanted to make it even better: The „wrong“ value of 200 should be replaced by a valid one and the average should be calculated out of 4 values, not 3.
I started with Excel to built up the logic:
AV_In is the input with 4 values. The 200 (in D2) should be seen as a „non valid“ one and been replaced. First I’m calculating the average of the 4 values (C3 = 807,5). After that I’m calculating the absolute (no minus sign) differences between each AV_In and the average (C4 - F4). After that I’m calculating the average of the differences (C5).
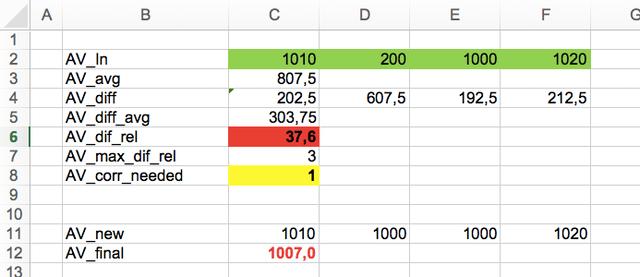
It’s already visible that the difference of the second value (D4 = 607,5) is the only one being higher than the average difference (C5 = 303,75).
In a next step I’m calculating the relative average difference (C6 = 303,75/807,5 = 37,6%) as an indicator if a correction is needed or not. By „playing“ with the figures I’m using 3% as a threshold. Because 37,6% is much higher, a correction is needed (C8).
Now the sketch is investigating the second value as to be replaced, because the difference is above the average difference. Now it's checking whether the nearby figures (1010 and 1000) are ok. Because the answer is yes, the 200 is replaced by the third value (in reality I’m replacing by the average of the figures, if both are valid). After repacement of the „non valid“ value, the average calculated from the 4 values (C11 - F11) is 1.007, which is much better than the initial 807,5.
I hope I’ll be able to finish the complete sketch as a prototype this week…
Update 10/22/2016
What a day today!!! Early in the morning I discovered, today is Tim’s „apple butter event“. He posted a note and picture on Facebook and I replied. After that I found at Geocaching Inventors a hint from Rob. I answered also to him and asked him to send me his sketch. By lunch time I received it. But meanwhile I’ve made a big step ahead with my own one. So I decided to have a short look to it and than to store it for later.
During the late morning I had to do some errands and also I had to work a little bit on electronics in my car. I thought, I totally scambeled it, but when I started the engine, it was working pretty fine. FIRST great succes today!
After a short lunch I was called by German Telecom. I’m suffering here with a quite slow internet connection. I’m paying for 16 MBit/s download, but usually I have roughly only 10. I thought, it would be never getting better, because the cable from the switching center to my flat is more than 2 miles long, but the direct distance to it is less than 500 feet. I saw no chance, a switching center would come closer. But the lady told me, they’re doing a complete new fiberoptic cabling and they’re offering 100 MBit/s from end of this year. Any surprise that I said „yes“ to a monthly increase of my fee by 10€??? SECOND great sucess of the day.
During the afternoon I was happy to solve all the remaining bricks and pieces with Frequency. THIRD success of the day!!!!
And here’s the final video clip:
As ever: When clicking on the YouTube icon, you can watch in 1080p — Don’t forget to switch your loudspeakers on!
After some relaxing on Sunday and again 2 quite busy weeks in front of me, I’ll do some testing with the microphone, when there will be time for it... I think, I must shield it from „storm“, because whistling didn’t worked great. But that’s are peanuts, or?
Update 10/29/2016
What I’ve wrote above, was correct… But not precise. Frequency is really working. But I orderd new microphones and also a 10-100 Op Amp, which is a kind of an amplifier. The approach with the amplifier doesn’t work. Or the other way round: It’s working much too fine. Even if it’s nearly silent, the Arduino is still listening something. It’s much too sensible now. Also with the other microphones I wasn’t happy with the results. Sometimes when whistling a higher tone, a lower one was measured. I think I’ll move working on this cache to „past Christmas“…
Why past Christmas? Because Tina just forced me to come up with a Christmas wish. You must know, it’s very difficult to find a gift for me. The saying is „Olaf owns it already or it’s much too expensive…“. So I came up with this one:
It’s a quite cheap ozilloscope from China, but still very oversized to my needs. Using it, I’ll discover what the microphone is hearing and will have a chance to bring this sketch to a quality, I want. But, this must wait at least up to the „time between the years“, as we’re calling the days between Christmas and New Year here in Germany.
Meanwhile I’ve finished „Jump&Run“ and my friend is quite excited about it.
I think my next one will be the first one using a LCD touch screen. I’ll call it as „working title“ Birduino… It’s already the 18th joint cache! Incredible but not really correct, because they’re some others still on hold - like Tetris…
Update 12/28/2016
And… Santa put it under the tree (assisted by Tina)!
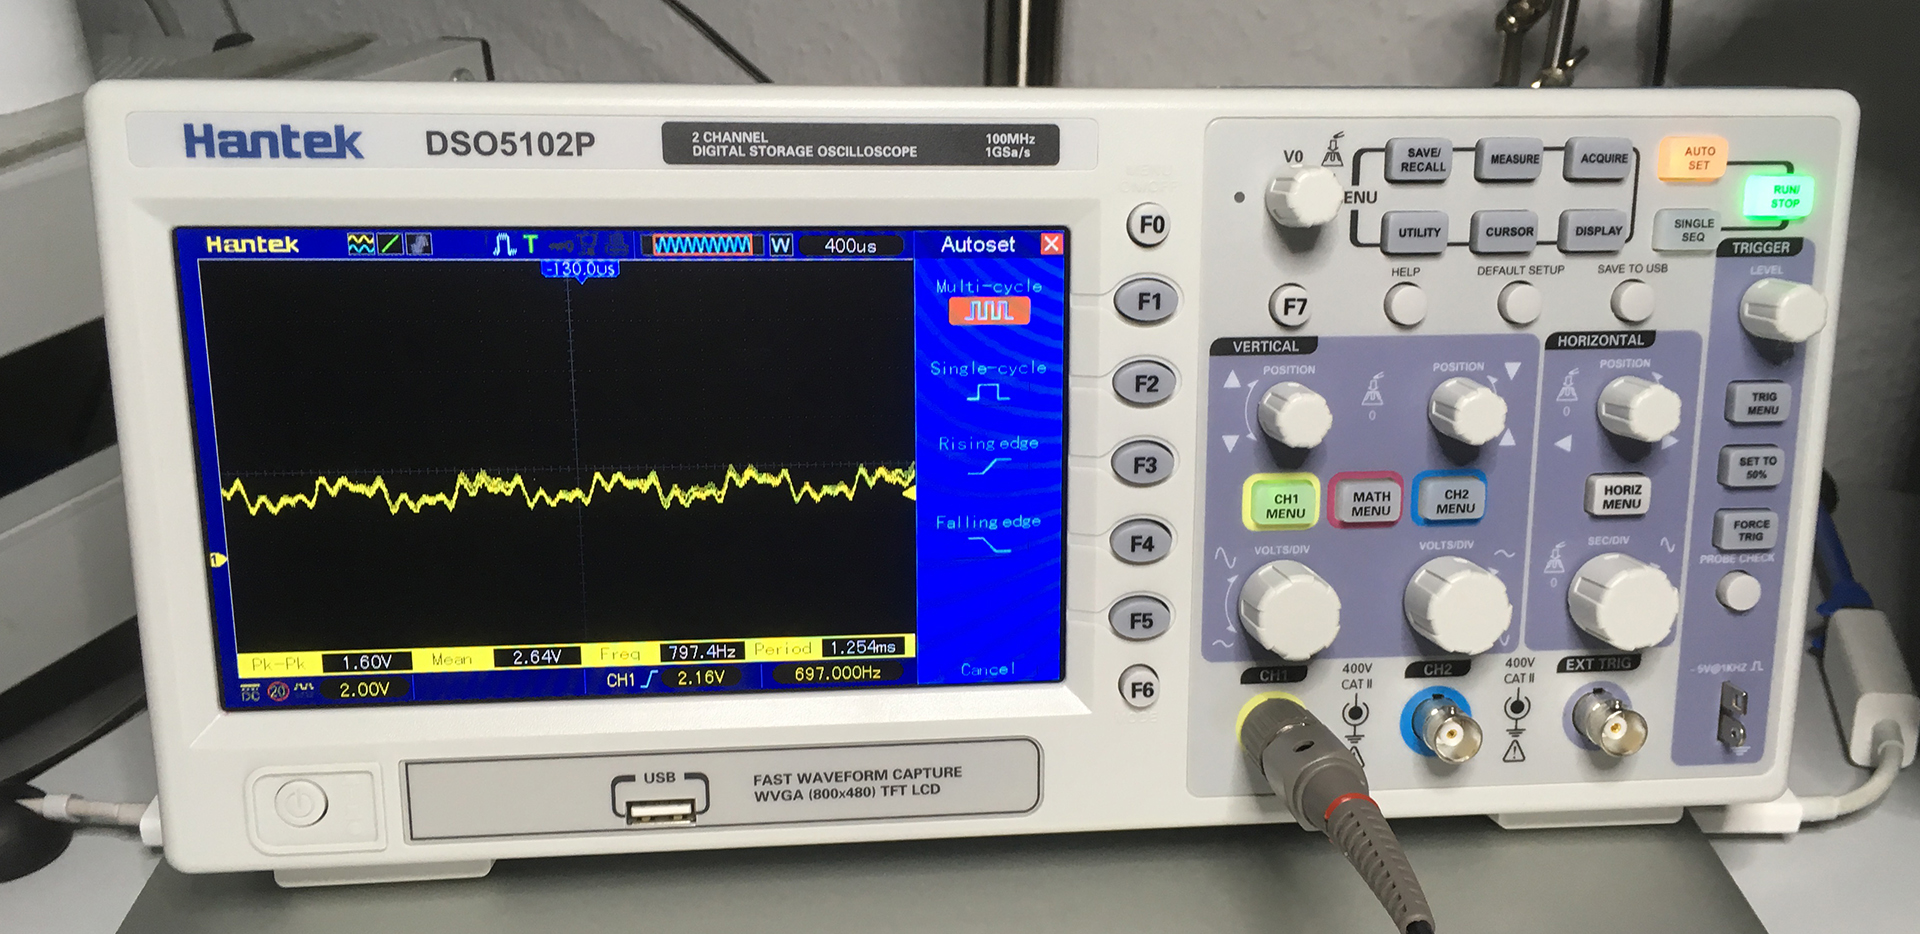
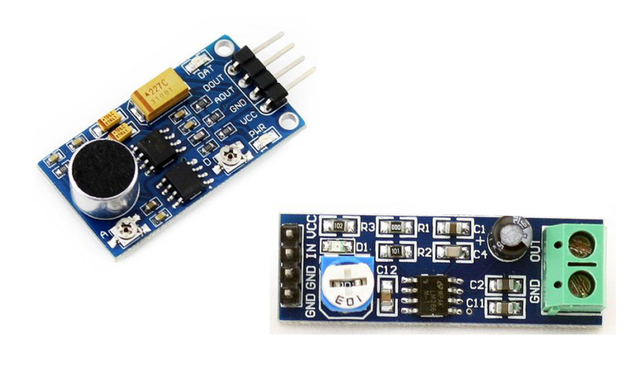
This is already the successful measurement of the frequency fetched by the microphone (the frequency of the loudspeaker is 800Hz and 797.4 are measured… not so bad) . But it was a quite long way upto this stage.
Above you can see, what I have done. The very tiny red breakout is the microphone. The signal goes via a capacitor to the larger red breakout on the left. That is a socalled „OpAmp“. An OpAmp is a kind of an amplifier. Using it, the difference of the noise fetched by the microphone and the real sound is much greater and so my measurement worked fine.
Update 29/12/2016 - OpAmp removed
Today I played a lot with my oscilloscope and the sketch. At the end I did a FaceTime with my colleague and now the measurement of the frequency is working quite fine. See the result here (first with a 900Hz tone received by the microphone, later nothing…):
Turn on your speakers!
The good thing is that my colleague is an expert in electronics, while I’m not. So first we removed the OpAmp, because it was mainly amplifying the noise and not the signal. After that we replaced the capicitor between the out of the microphone and the input pin of the Arduino, because I have used one with much too much capacity. Now it has 1uF
At this moment the test sketches for 1.) making a tone and 2. the measurement of the frequency are running fine, while my main sketch isn’t. Next days I need to check it or I’ll write it again from scratch…
Update 12/30/2016 - It’s done!!!
Did anyone forced me to finish this year? No! But I was happy to have the time to do so. I didn’t need to rewrite the whole sketch, but some bug fixing was needed. Here’s the video clip of the final prototype:
Turn on your speakers!
As ever: Clicking the YouTube icon, you can watch in 1080p
Update 1/1/2017 - It’s done??? Not really!
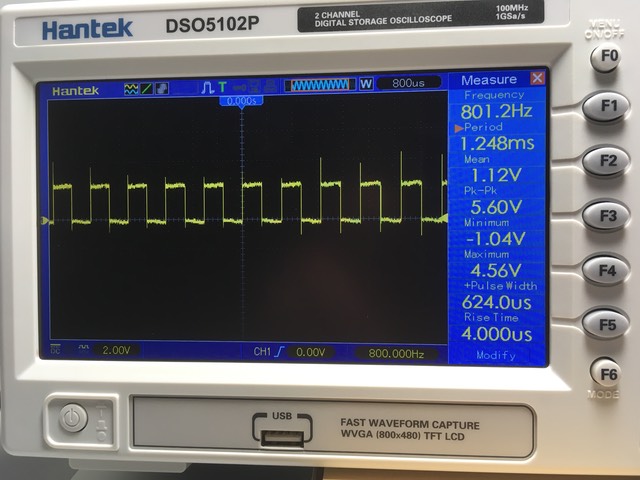
Having my first working day tomorrow, I played today again with the sketch and my oscilloscope. Here’s a picture of the signal produced by my tone generator:
And this is the signal given from the microphone to the Arduino:
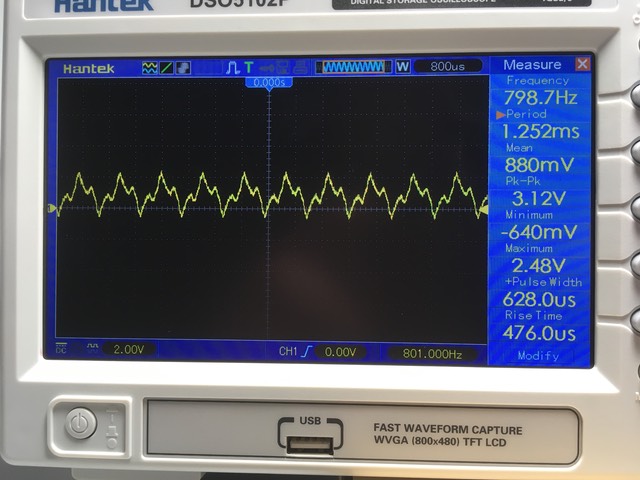
In this case the the little loudspeaker was only 0.4 inch away from the microphone. A peak to peak level of > 3.1 V is fine and the sketch worked. But this is the result with the loudspecker rougly 4 inch away:
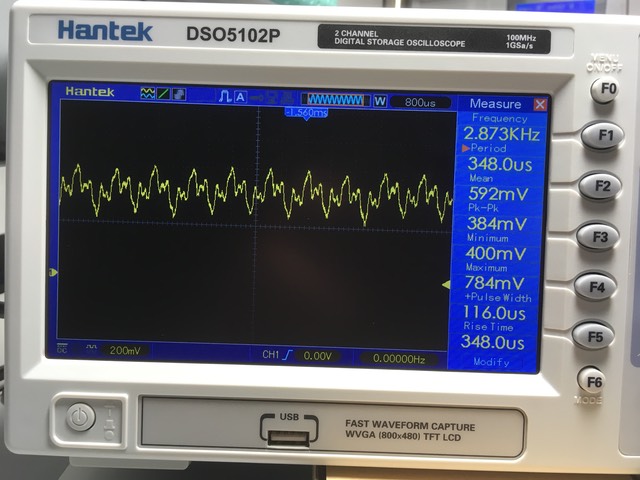
The peak to peak level is down to 384 mV (with a quite signifikant minimum level of 400 mV). I that case my sketch isn’t working, because I’m measuring the frequency with a digital pin and so the maximum Voltage must be > 2.5 V. I fear, my first idea with an amplifier wasn’t so bad, but an OpAmp was wrong. I don’t need an amplifier which is choosing the amplifying rate by itself and also a maximum amplifying rate of nearly infinity.
This is inline (even not exactly) with the data sheet of this tiny microphone breakout:
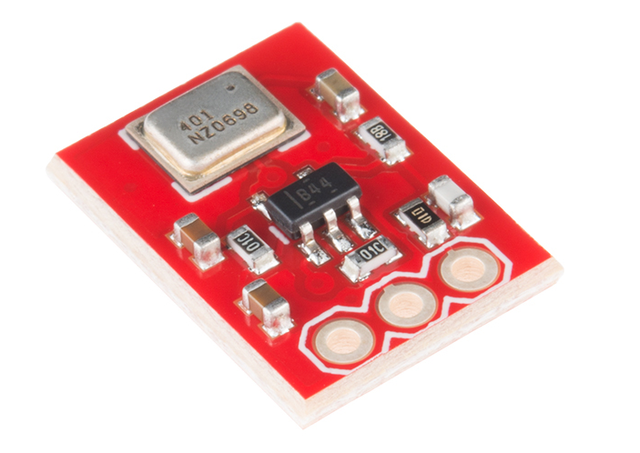
There is said, that „one armlength" away and with „normal loudness“ the peak-to-peak level is 200 mV with an offset of 800 mV. This means that the voltage the microphone is giving is between 0.7 and 0.9 V. A peak-to-peak level of 0.2 V is compared to the ability of the analogue pins to handle between 0 and 5.0 V very very poor. So today I just ordered some stuff to test:
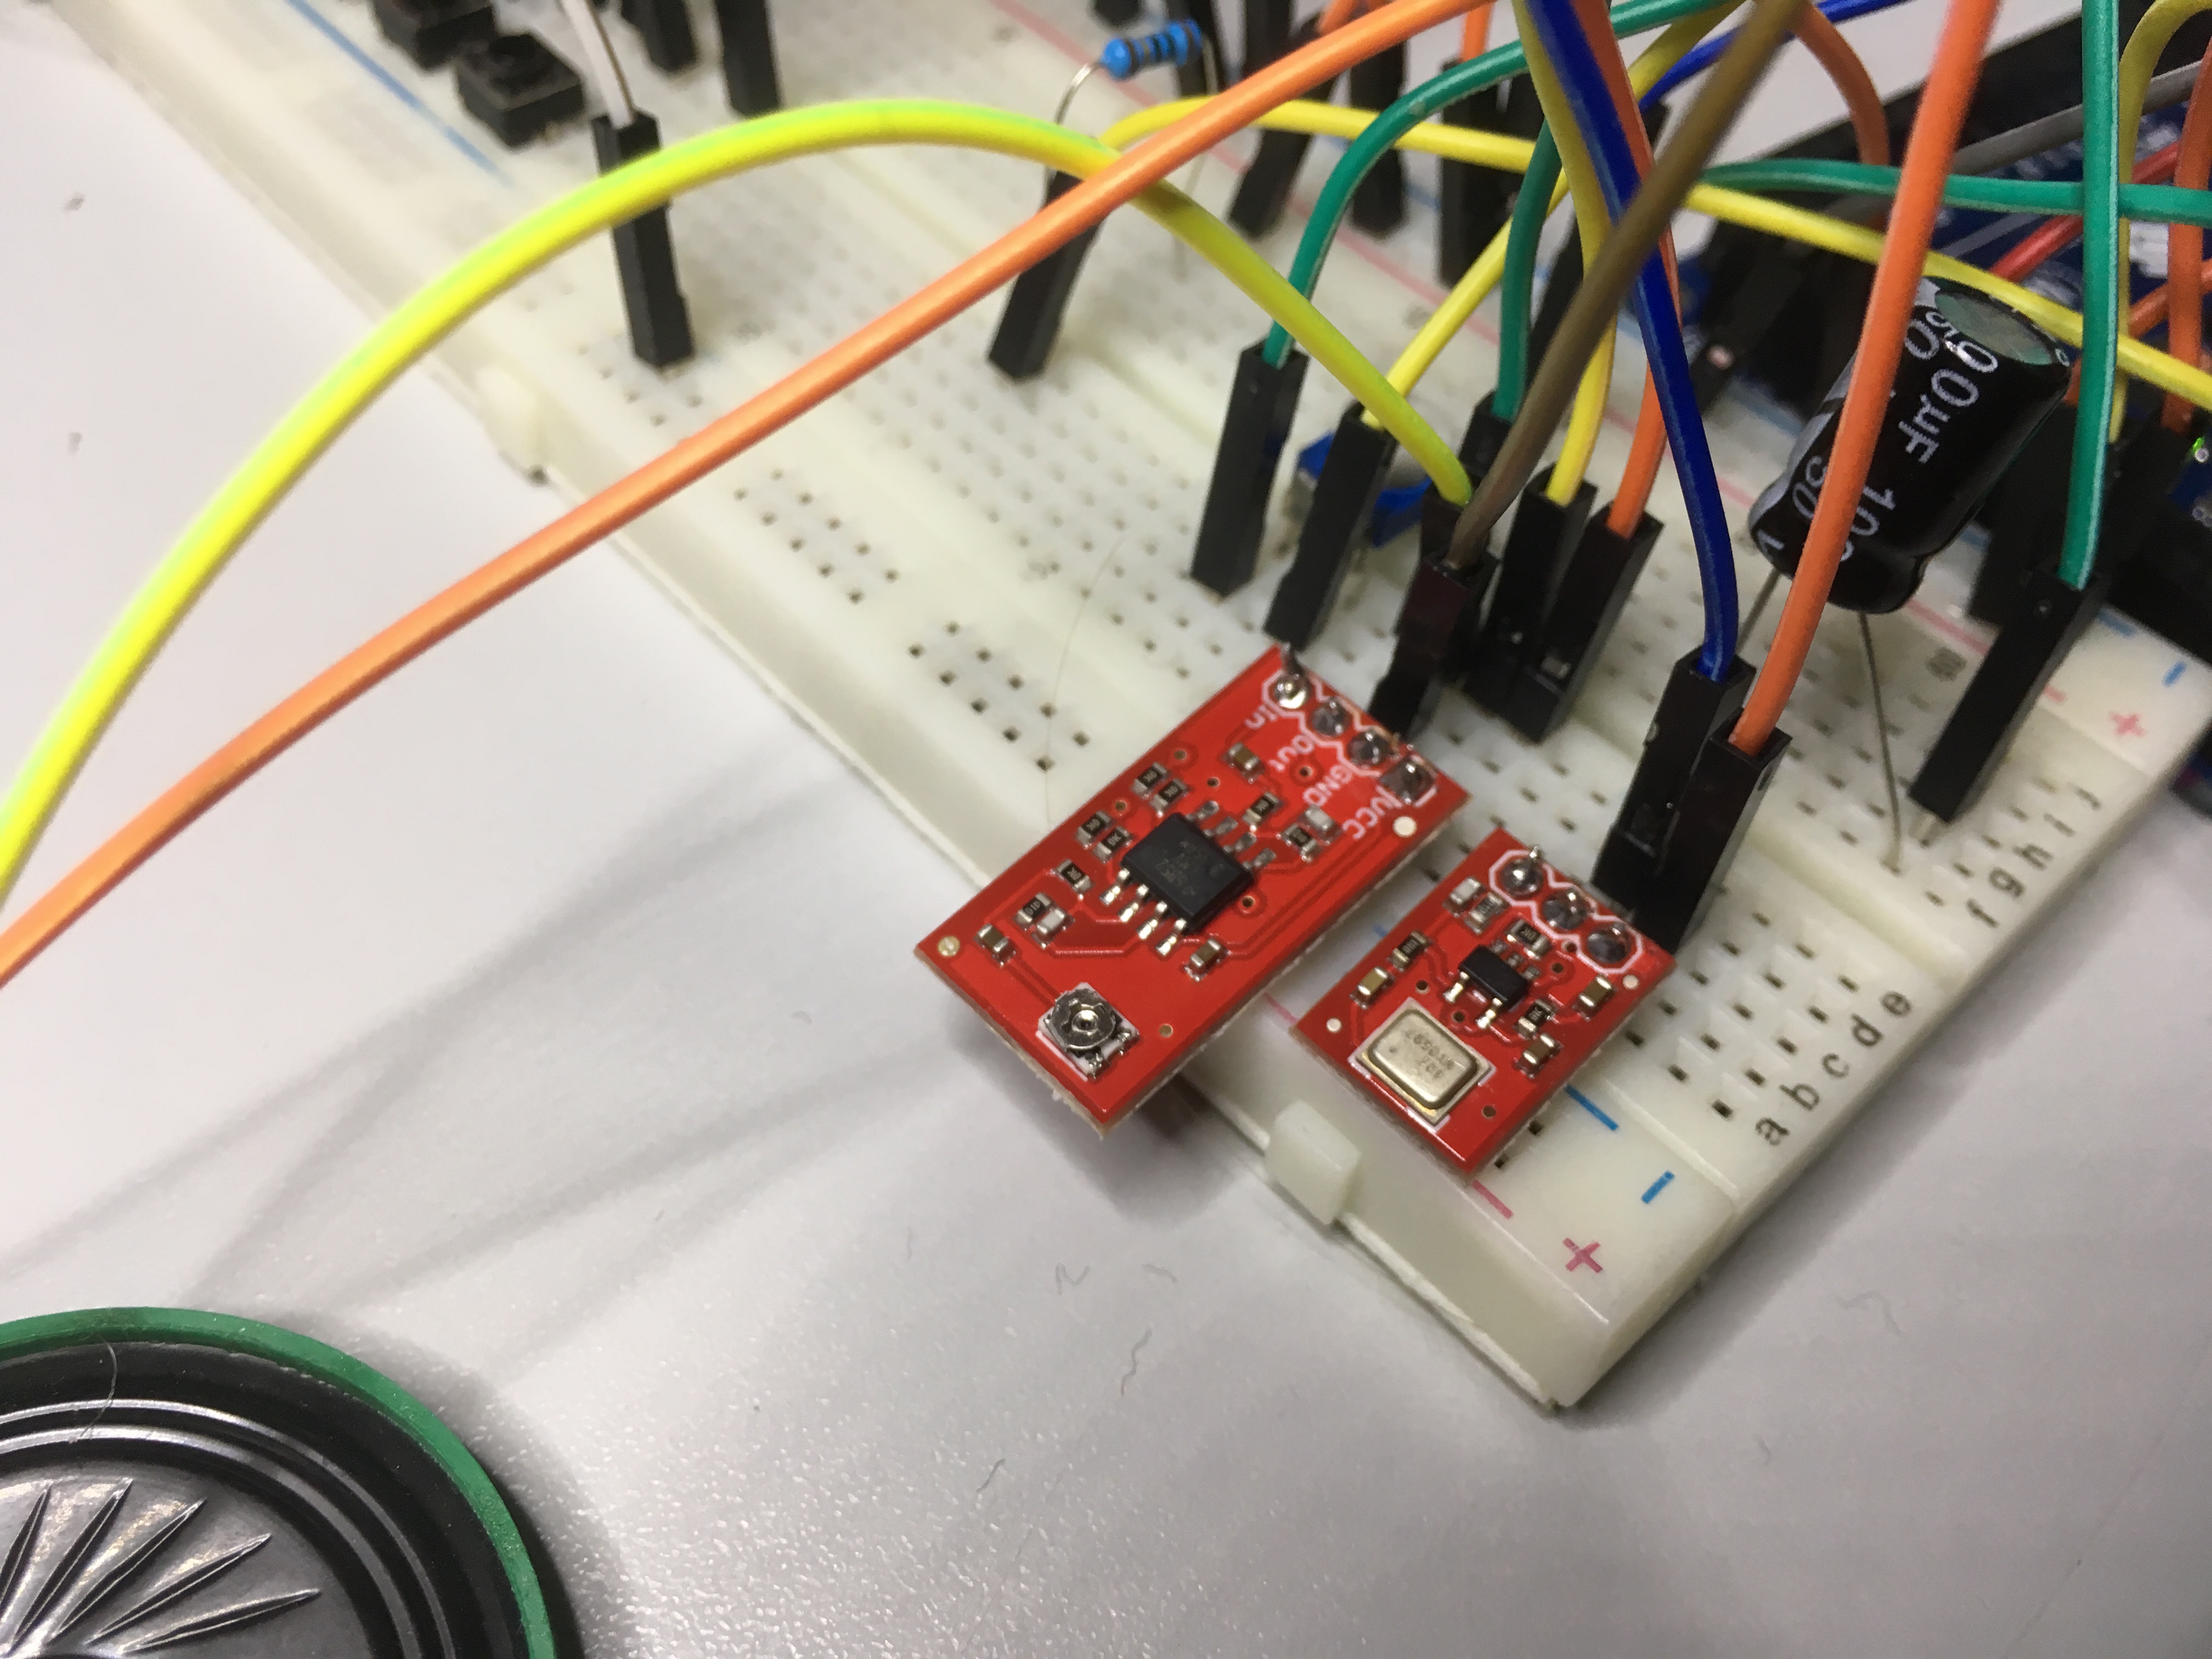
Upper left you can see a microphone breakout with an integrated amplifier, which can be adjusted (between 1:1 and 1:200)manually. Botton right you can see an adjustable amplifier. You can adjust an amplifying rate up to 20x. I ordered another one, looking quite the same, but with a range up to 200x.
The stuff will arrive on Wednesday latest and I’ll perform some test with it. Finally I need to decide to stay in measuring with a digital pin or alternatively with a analogue on. Only some few lines of the sketch to change…
Update 1/2/2017 - automatic microphone calibration
All wrong, so deleted… See next entry...
Update 1/3/2017 - all I’ve talked about yesterday was... WRONG!
I’ve talked with my colleague today. He’s an expert in electronics, while I don’t know anything about. I can only use my knowledge in mathematics and physics and my logical capabilities as well.
The result is that all I talked about yesterday was wrong, even when I fetched the main issues. This is why I deleted the entry from yesterday and will describe, what we discussed this morning.
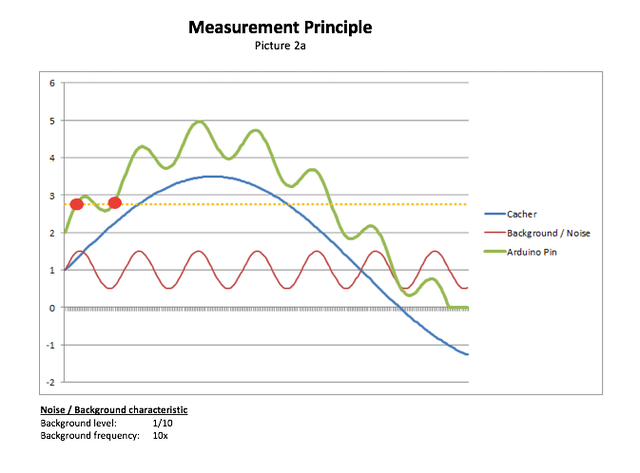
My main idea of an optimal setting of the threshold to count the frequency is still valid. The main principle is shown here:
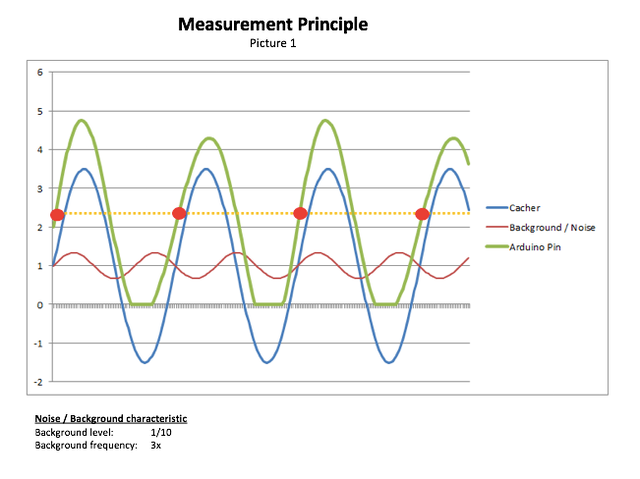
The green line is the input, the Arduino is measuring. As you can see, the Arduino is only able to measure values (volt) beween 0 and +5 V. Voltages below 0 V (meaning negative ones) are skipped. Because me don’t want to record the sound but only want to measure its frequency, that’s no problem. Otherwise we would have to shift the input up (meaning to ad a stable voltage as mean value (e.g. 2.5 V) so the input would change between 0 V and 5 V. But that’s not needed in our case.
This green line is the result of the tone, the cacher is generating (blue) and background noise (red). Background noise could be a bird singing, any other noise from other sources or just disturbances from the electonics. In my example the level of the background noise is only 1/10 of the one from the cacher and the frequency is 3 times the one, coming from him.
The principle of the program is to count whenever the signal is increasing from below a threshold to above that threshold (yellow line). This is happening in this example 4 times (red bullets).
My question was, is there an optimal value, this threshold should have? It’s obvious, it shouldn’t be set too high. In my example a value of 4.5 V would be only reached by the first and the third green wave.
But what’s with too low? Might there be a problem, when it would be inside the noise range (up to 1.5V in this example)?
Here’s the same situation as above, but now with a kind of a 10x zoom:
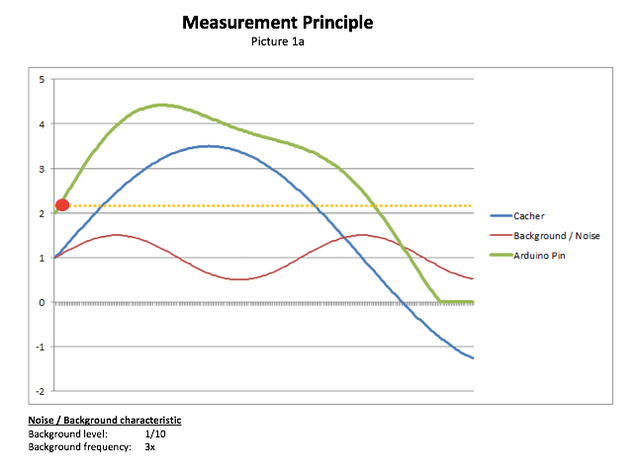
There’s still no problem, even when the noise is overlaying the green line.
Now a different situation:
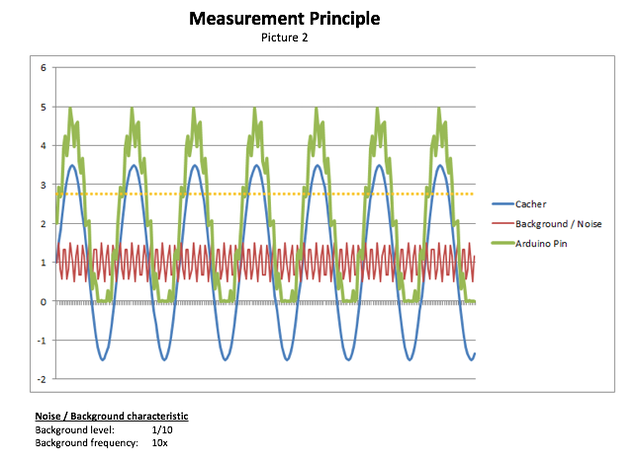
The level of the background noise is still only 1/10 of the signal from the cacher, but the frequency is 10 times the one produced by him. Let’s use the „zoom“ again:
In this case it will happen 2 times that the signal is going from below threshhold to above threshold while correct regarding the frequency of the initial blue line (from the cacher) would be only once.
Going back to picture 2 you’ll see that this problem is occurring everywhere between 0 V and max peak voltage.
So the issues to measure wrong are:
- Threshold too high (sometimes the peak sound level might be below threshold)
- Background/noise : The louder, the worth
- Background/noise: The higher it’s frequency, the worth
So by logic it should be ok, even if the threshold for counting is within the background/noise level. But anyway, I’ll put it above it. But we need to be aware, that the measured is a little bit too high. But I hope to compensate that with my „avarage approach“ described on 10/21/2016 above.
I’ll update the sketch like that and I’m nosy to test it when the ordered stuff will arrive my desk, which should happen tomorrow...
Update 1/5/2017 - still a long way ahead
Hardware arrived yesterday, but I’m still not happy. But just prior switching the iMac off, I discovered the function analogReference(). This might be helpful. But I’m working now on a new sketch first to test that and second to finally decide, if I’ll use the analog (as I previous already decided) or the digital output coming from the microphone breakout.
Update 1/8/2017 - what a horrible cache!
What I described above was also not helpfull in reality. I tested a lot and failed. Unfortunately in the most worse way: If something isn’t working, you can try to find the mistake. But if something is working sometimes and sometimes not, it’s much more difficult to work on that issue.
That’s the status of „just now“:
- I’m not able to understand for what the digital output of the microphone breakout is. It can’t be a real PCM digital out. Even turning the potentiometer for digital out on that breakout I wasn’t able to understand for what this is.
- Even when my oscilloscope is giving a quite fine peak-to-peak of > 3.5V at the analog output of the microphone break out, when sound is received by it, the levels measured at an analog pin of the Arduino are quite bad. Another thing I don’t understand.
- I asked Dr. Google for measuring frequencies with an Arduino and found a lot:
- my way of measuring with an analog pin
- measuring the analog out with a digital pin, just discovering, if the signal goes from LOW to high
- like above, but using the command pulseIn(). This one seems to work pretty fine and I’m just updating my complete sketch by this approach.
But by using a digital pin, I’m no longer able to investigate background noise or set a minimum level of the loudness the cacher must reach. Maybe that’s not needed. I’ll try to find some time this afternoon to go on. But one thing is clear: This cache will not be the most expensive, I ever worked on, because without the oscilloscope from Santa (=Tina) there would be no chance to work on it. This cache is also the most horrible one, I ever worked on. The level of frustration is sometimes like as with Lasers. But with Lasers I struggled with hardware, with Frequency with software...
… but done!
This afternoon I finally did it. Analog out going to a digital pin, so no calibration needed. And I only used the new microphone, not the separate amplifier. They’ll stay in my local stock for future exercises. (But for sure it will take very, very long up to I will come back to work with audio!)
Finally I did some nice modifications:

Do you see the array frequency_tollerance [ ]? Here you’re deciding how many full tones based on the basis tone the cacher has to go up. In this case: 1 tone up, 2 tones up, 3 tones up, 1 tone below basis tone. In addition I integrated a value for correction. When I measured a 800 Hz tone, the result was 810 Hz. Putting this into the sketch will correct the result...
Below you can see the calculation of the next tone (I played with Indian 12 tones octaves…).
If you’re aware about
- 1 octave higher means doubling the frequency
- 1 octave consist of 8 tones (Indian = 12)
the next tone above the basis tone has a frequency 1/8 higher than it:
next tone = basis_freq + (basis_freq * 1 / 8) or
next tone = basis_freq * ( 1 + (1/8))
or n tones higher:
n_tones_higher = base_freq * ( 1 + n/8))
The sketch is in your DropBox and also ready to be downloaded from the sketch page...